plot(co2)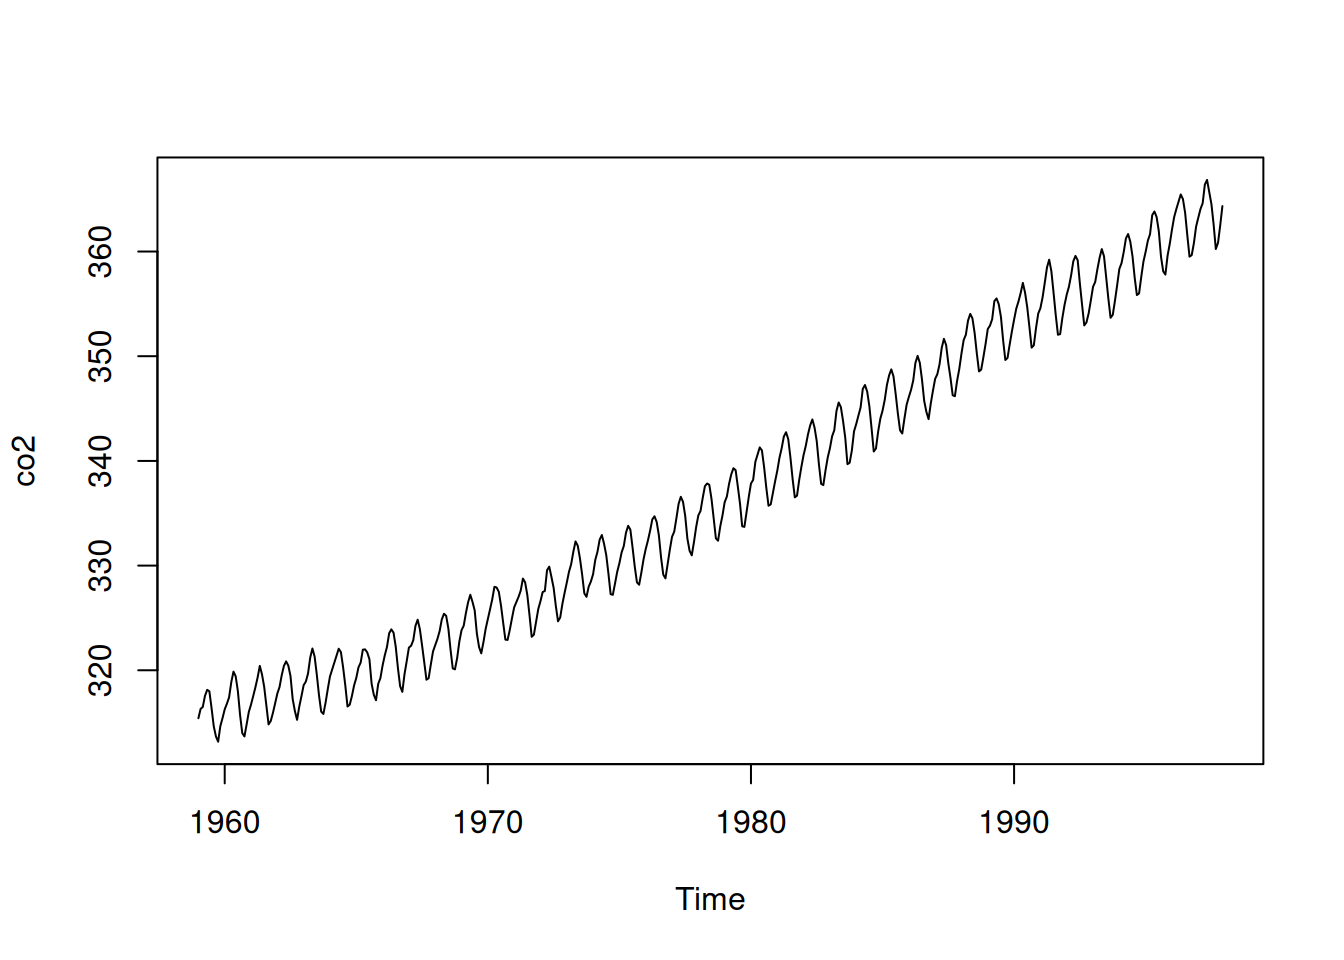
We will start with time series models, because they are
Time series models are roughly divided in
Spatial equivalents are mostly found in (a), although (b) has spatial equivalences as well (e.g. wavelets).
Consider the following process (\(\Delta t\) = 1 month):
plot(co2)
Perhaps the simplest time series model is white noise with mean \(m\):
\[y_t = m + e_t, \ \ e_t \sim N(0,\sigma^2)\]
\(N(0,\sigma^2)\) denoting the normal distribution with mean 0 and variance \(\sigma^2\), and \(\sim\) meaning distributed as or coming from.
\(t\) is the index \(t=1,2,...,n\) of the observation, and refers to specific times, which, when not otherwise specified are at regular intervals.
A white noise process is completely without memory: each observation is independent from its past or future. Plotting independent, standard normal values against their index (the default for plotting a vector in R) shows how a white noise time series would look like:
white.noise = rnorm(100)
plot(white.noise, type='b')
title("100 independent observations from N(0,1)")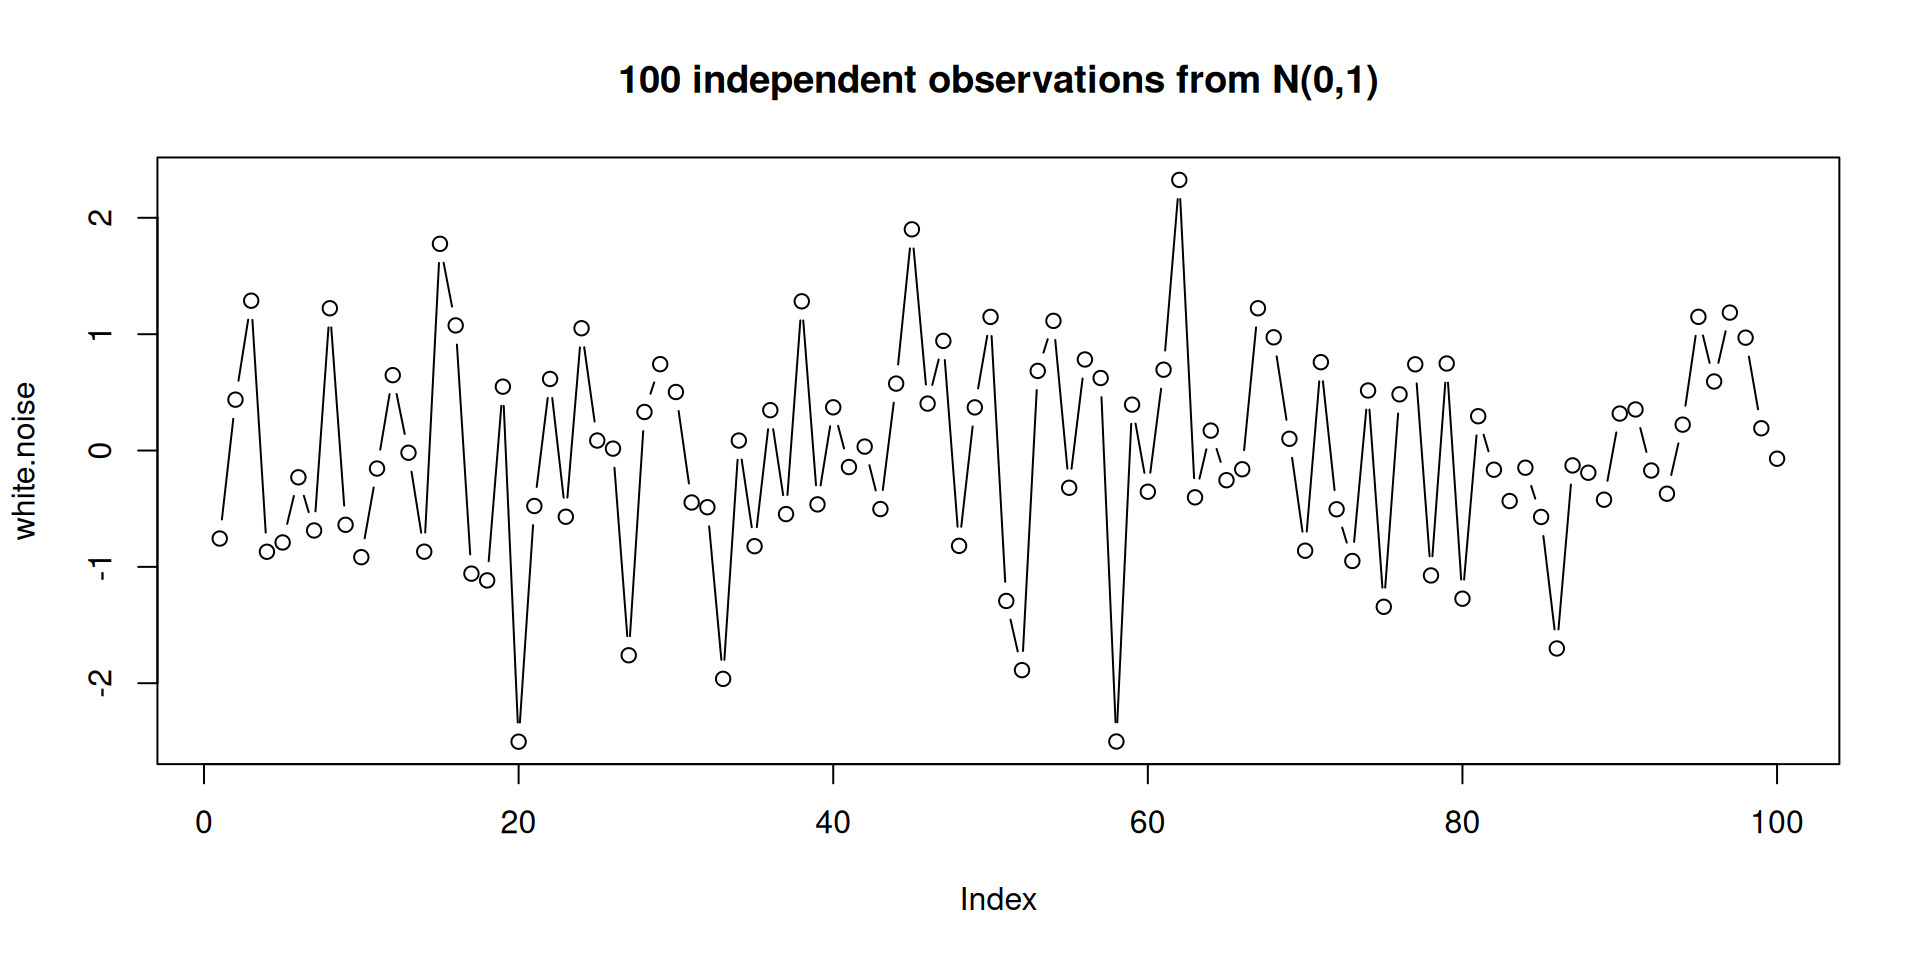
white.noise = rnorm(1000)
plot(white.noise, type='l')
title("1000 independent observations from N(0,1)")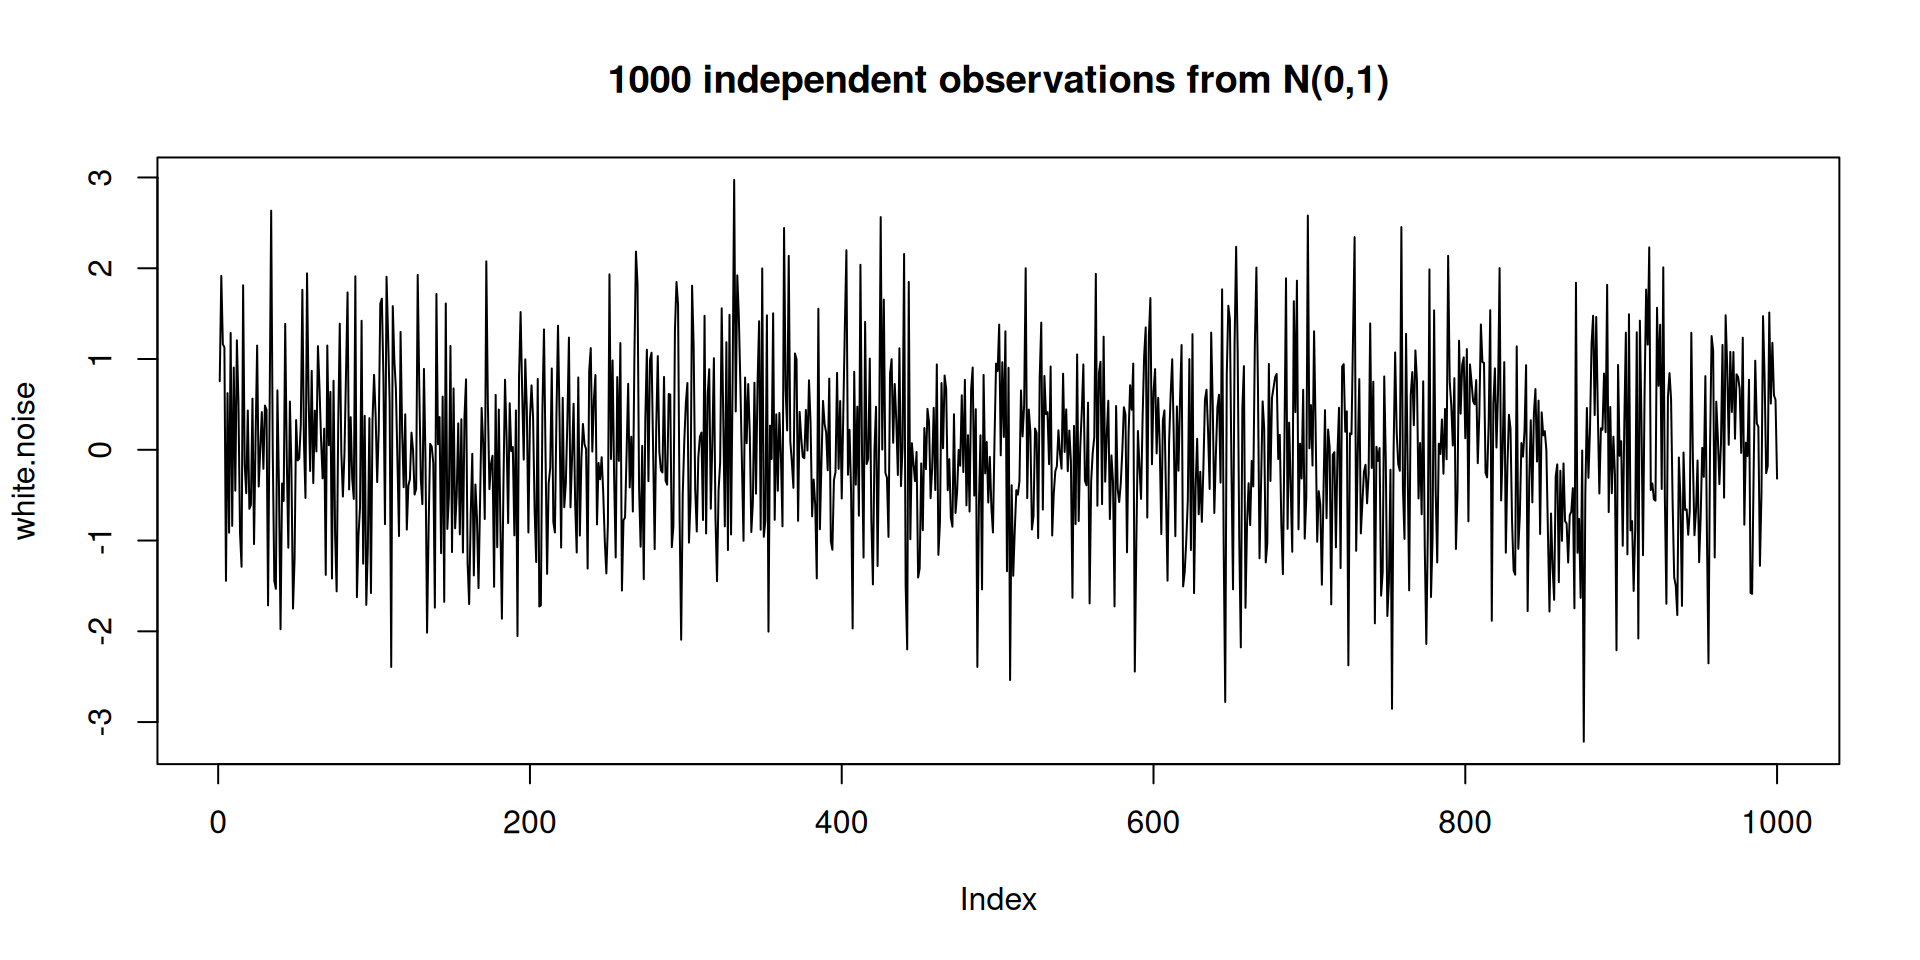
white.noise = rnorm(10000)
plot(white.noise, type='l')
title("10000 independent observations from N(0,1)")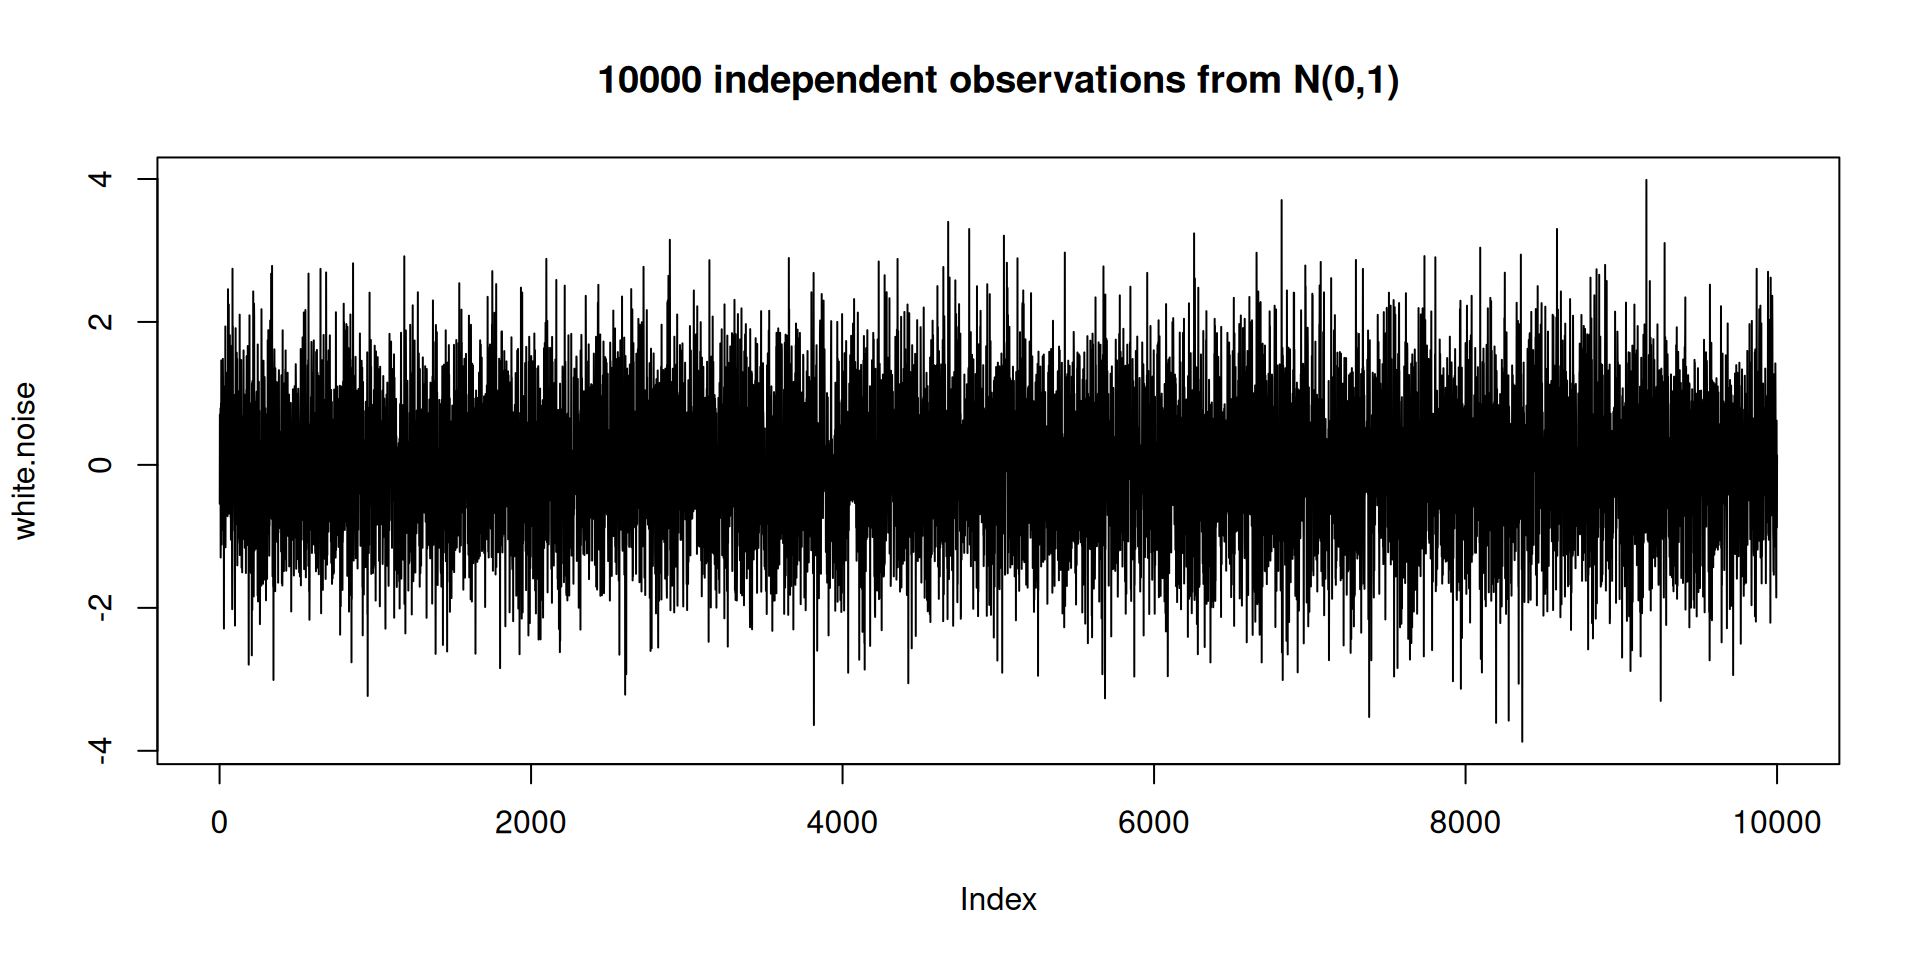
We can look at the auto-correlation function of a white noise process, and find it is uncorrelated for any lag larger than 0:
plot(acf(white.noise))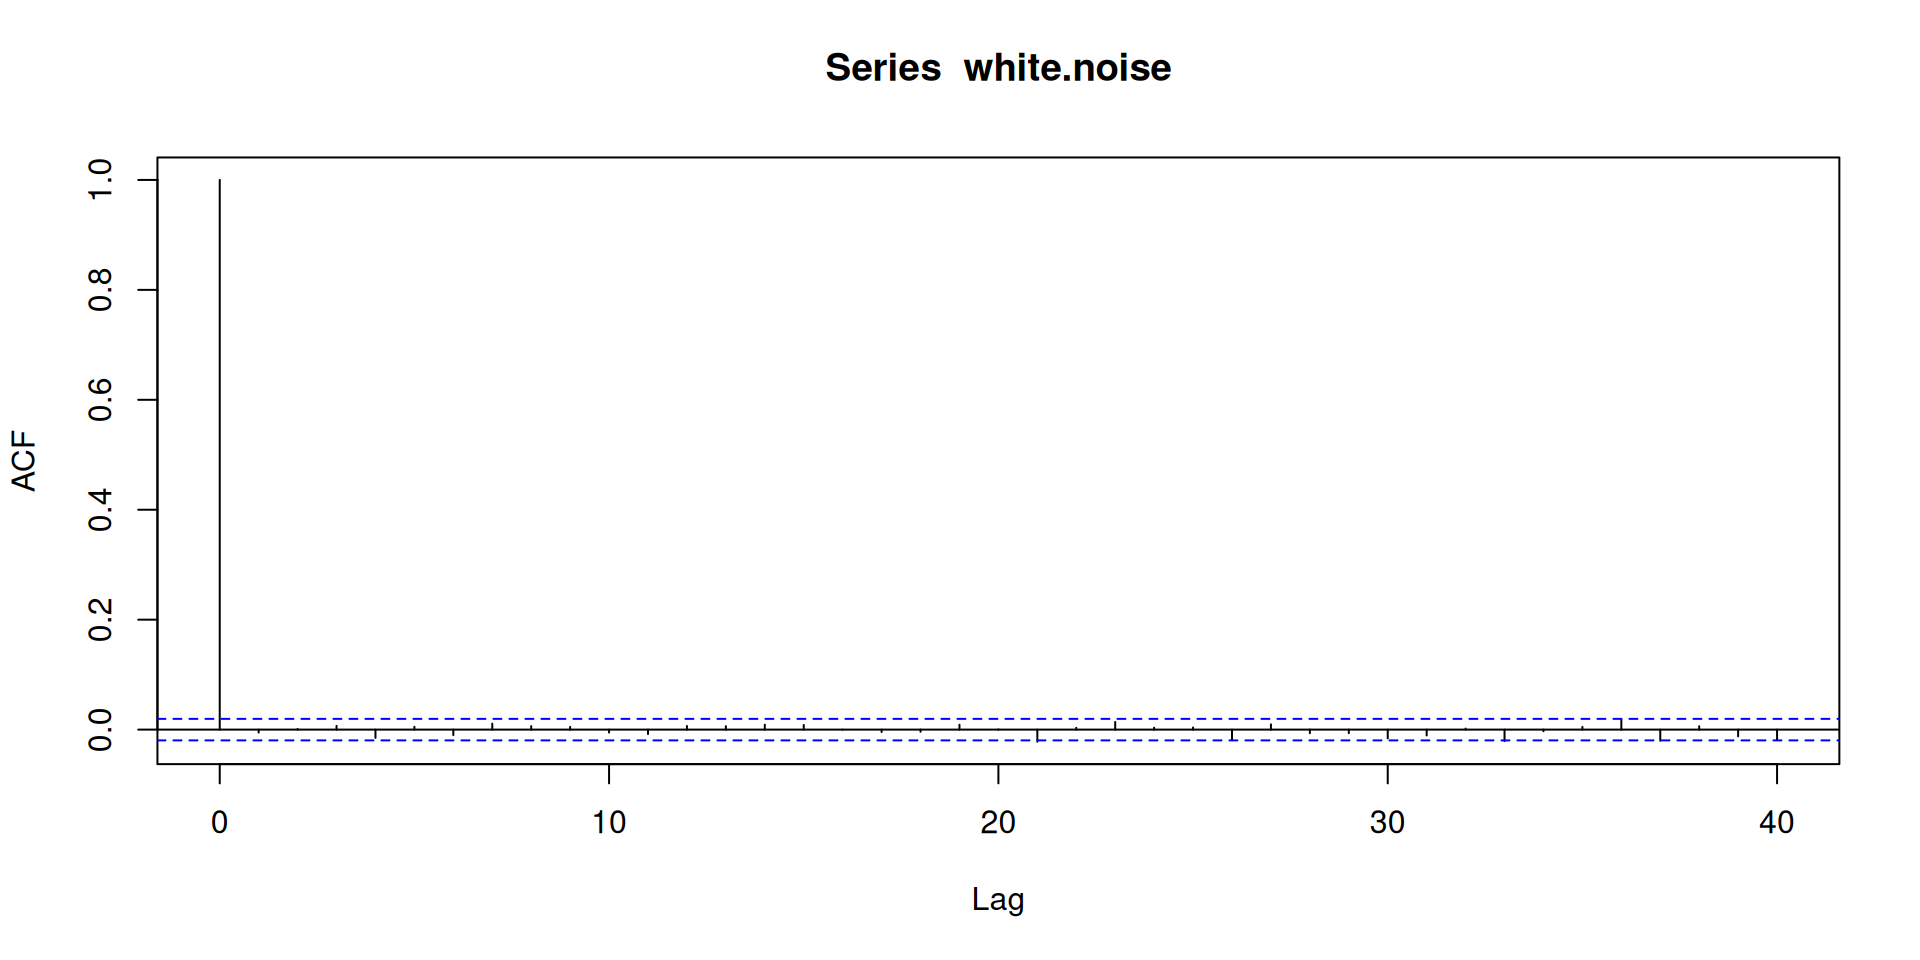
The correlation between \(x\) and \(y\) is, as you may recall, estimated by: \[ r(x,y) = \frac{\sum_{i=1}^{n}(x_i-\bar{x})(y_{i}-\bar{y})}{\sqrt{\sum_{i=1}^n (x_i-\bar{x})^2\sum_{i=1}^n(y_i-\bar{y})^2}} \]
Autocorrelation (or lagged correlation) is the correlation between \(y_i\) and \(y_{i+h}\), as a function of the lag \(h\): \[ r(h) = \frac{\sum_{i=1}^{n-h}(y_i-\bar{y})(y_{i+h}-\bar{y})}{\sum_{i=1}^n (y_i-\bar{y})^2} \] with \(\bar{y} = \frac{1}{n} \sum_{i=1}^n y_i\)
A simple, next model to look at is that of random walk, where each time step a change is made according to a white noise process: \[y_t = y_{t-1} + e_t\] Such a process has memory, and long-range correlation. If we take the first-order differences, \[y_t - y_{t-1} = e_t\] we obtain the white noise process.
Further, the variance of the process increases with increasing domain (i.e., it is non-stationary)
We can compute it as the cumulative sum of standard normal deviates: \(y_n = \sum_{i=1}^n e_i\):
# generate three series:
rw1 = cumsum(rnorm(5000))
rw2 = cumsum(rnorm(5000))
rw3 = cumsum(rnorm(5000))
plot(rw1, type='l', ylim = range(c(rw1,rw2,rw3)))
lines(rw2, type='l', col='red')
lines(rw3, type='l', col='blue')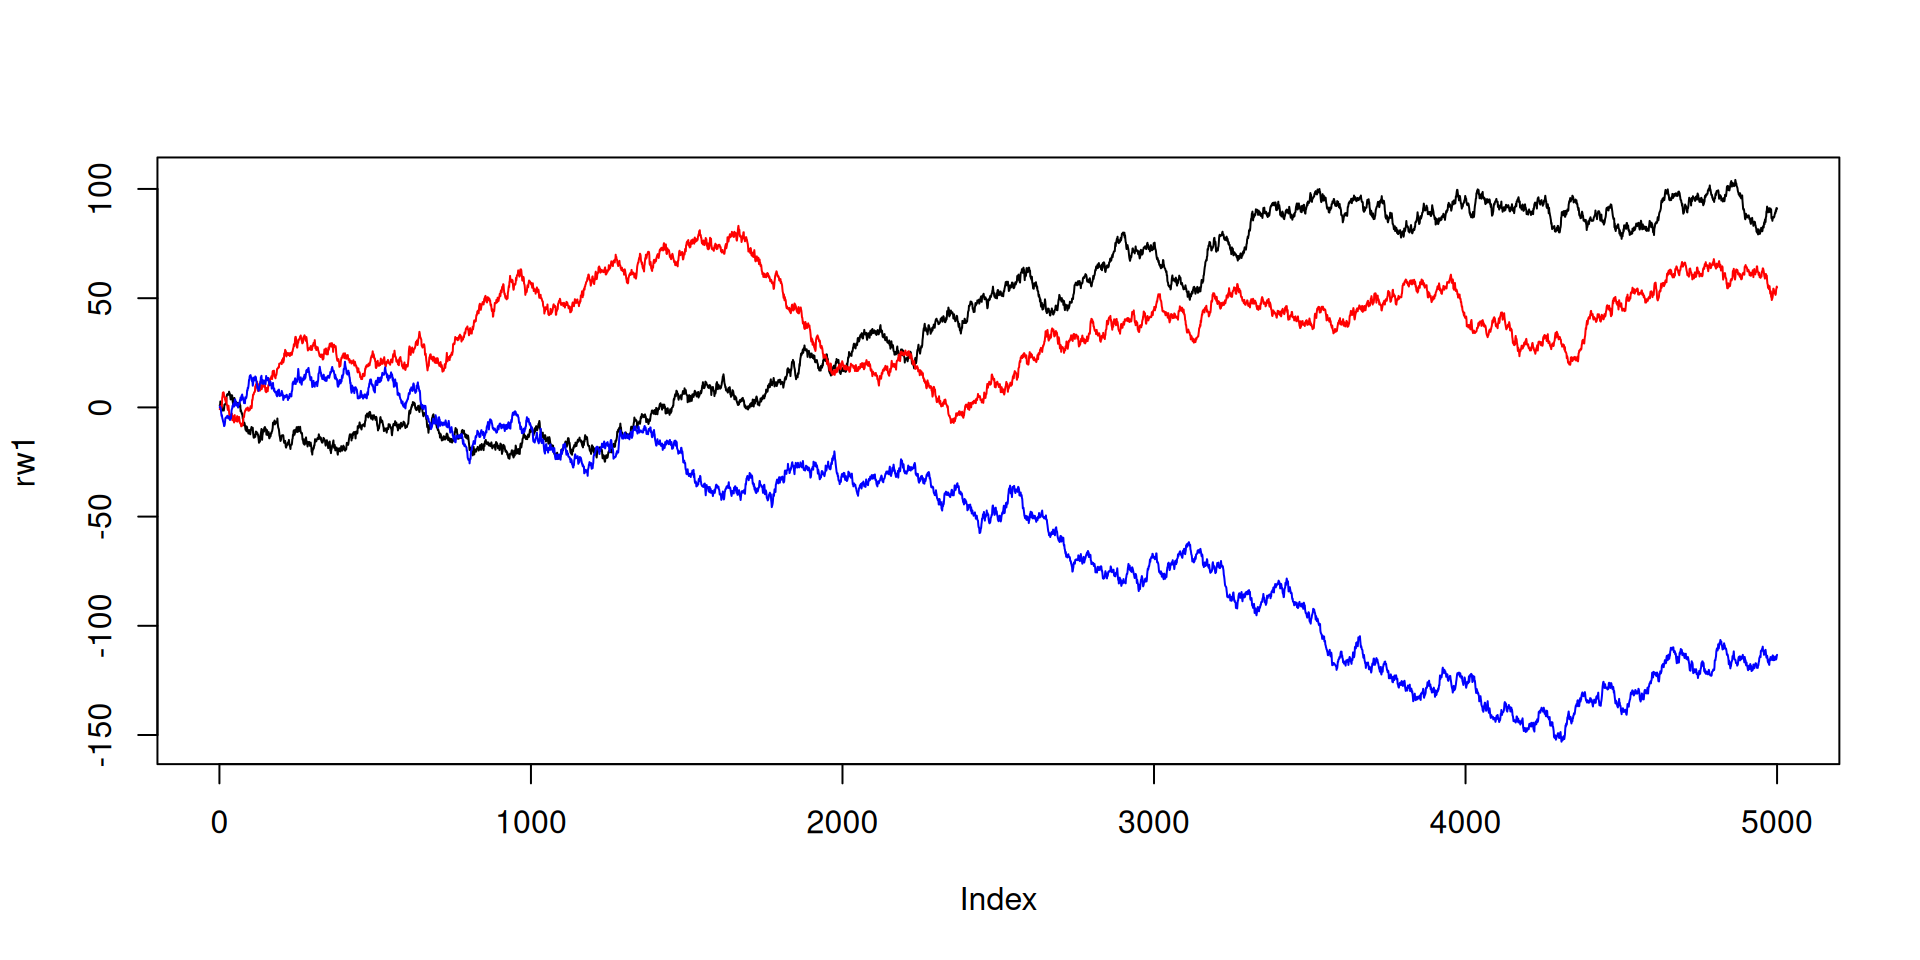
plot(acf(rw3))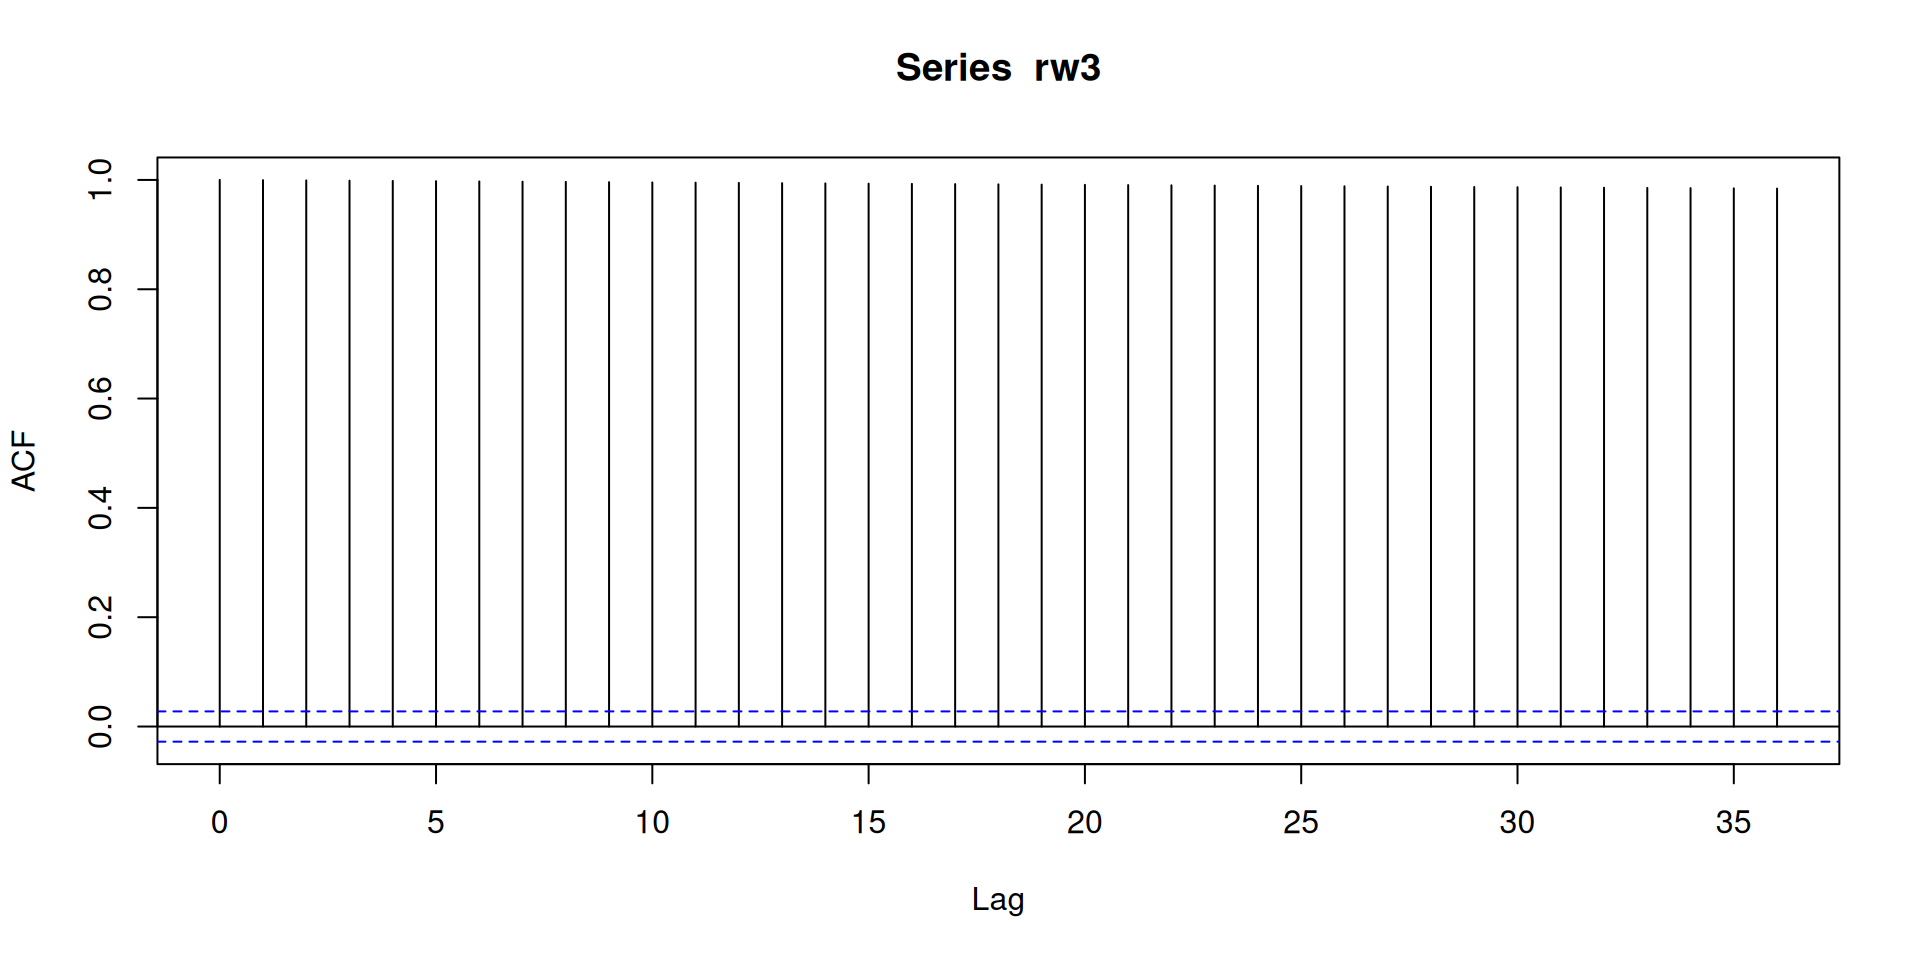
plot(acf(diff(rw3)))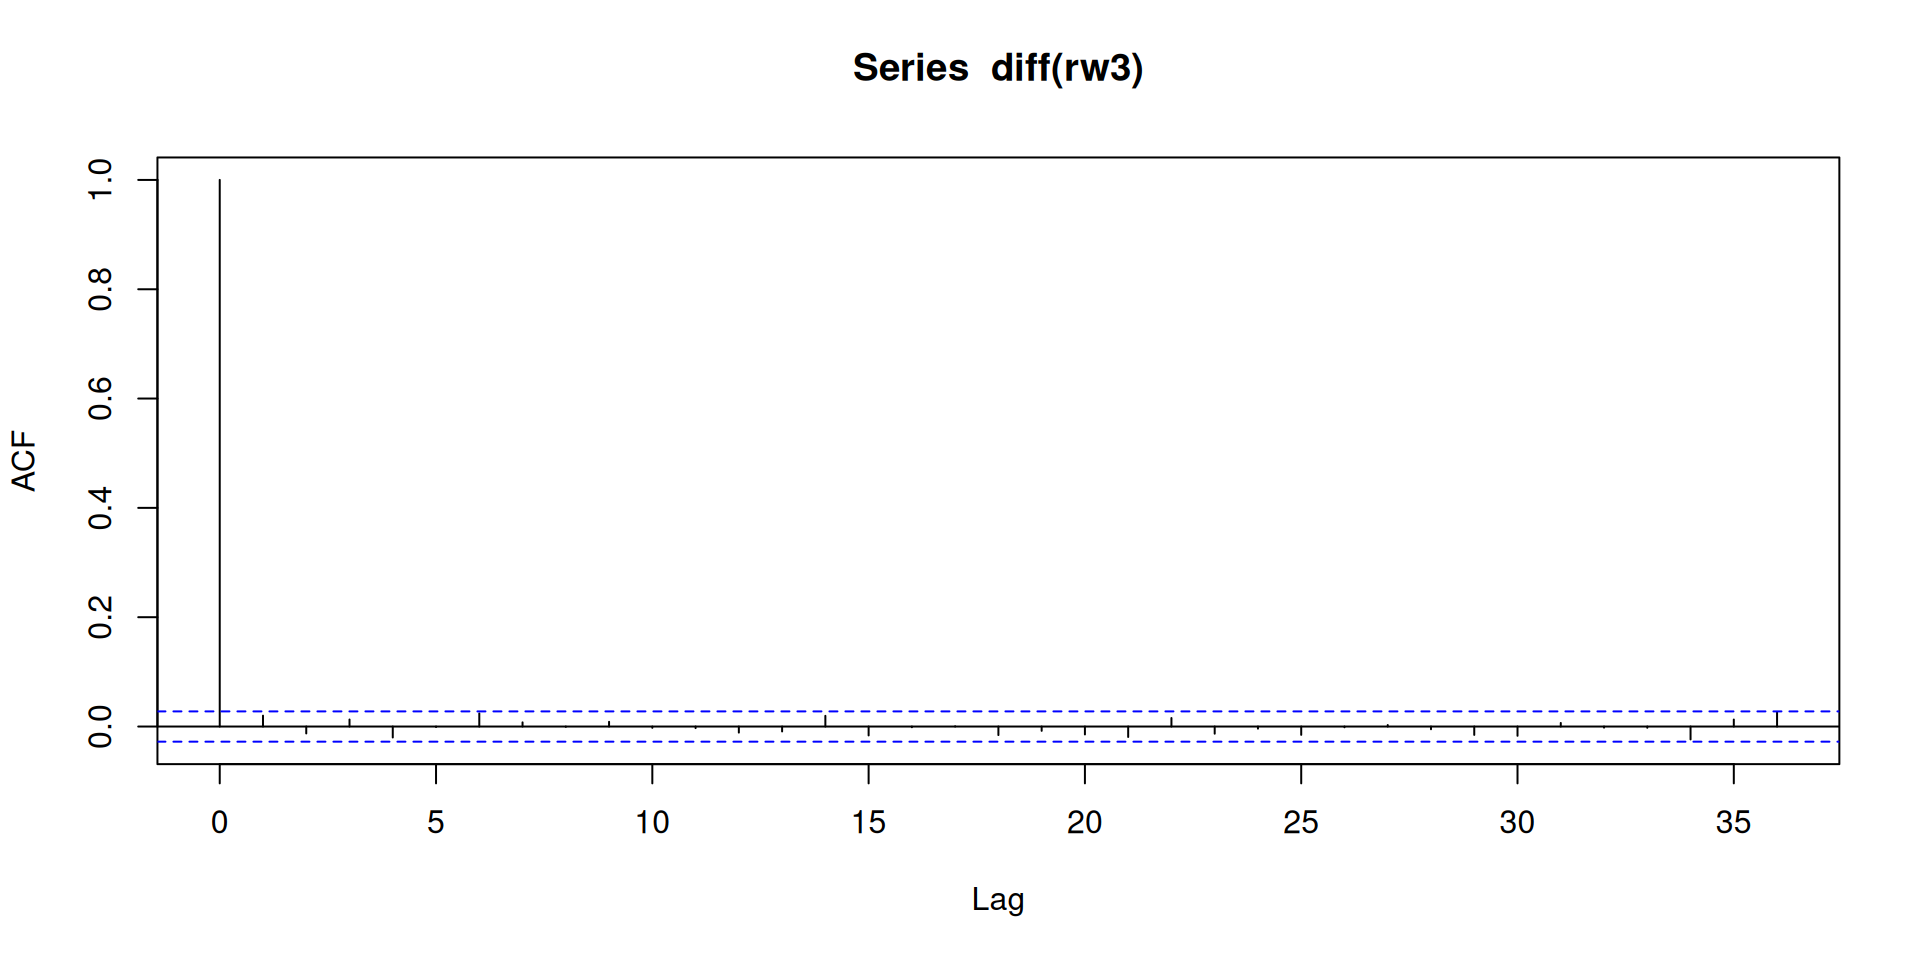
Let \(e_t\) be a white noise process. A moving average process of order \(q\) is generated by \[y_t = \beta_0 e_t + \beta_1 e_{t-1} + ... + \beta_q e_{t-q}\]
Note that the \(\beta_j\) are weights, and could be \(\frac{1}{q+1}\) to obtain an unweighted average. Moving averaging smoothes the white noise series \(e_t\).
Moving average over monthly CO2 measurements on Maunaloa:
plot(co2)
lines(filter(co2, rep(1/12, 12)), col='blue')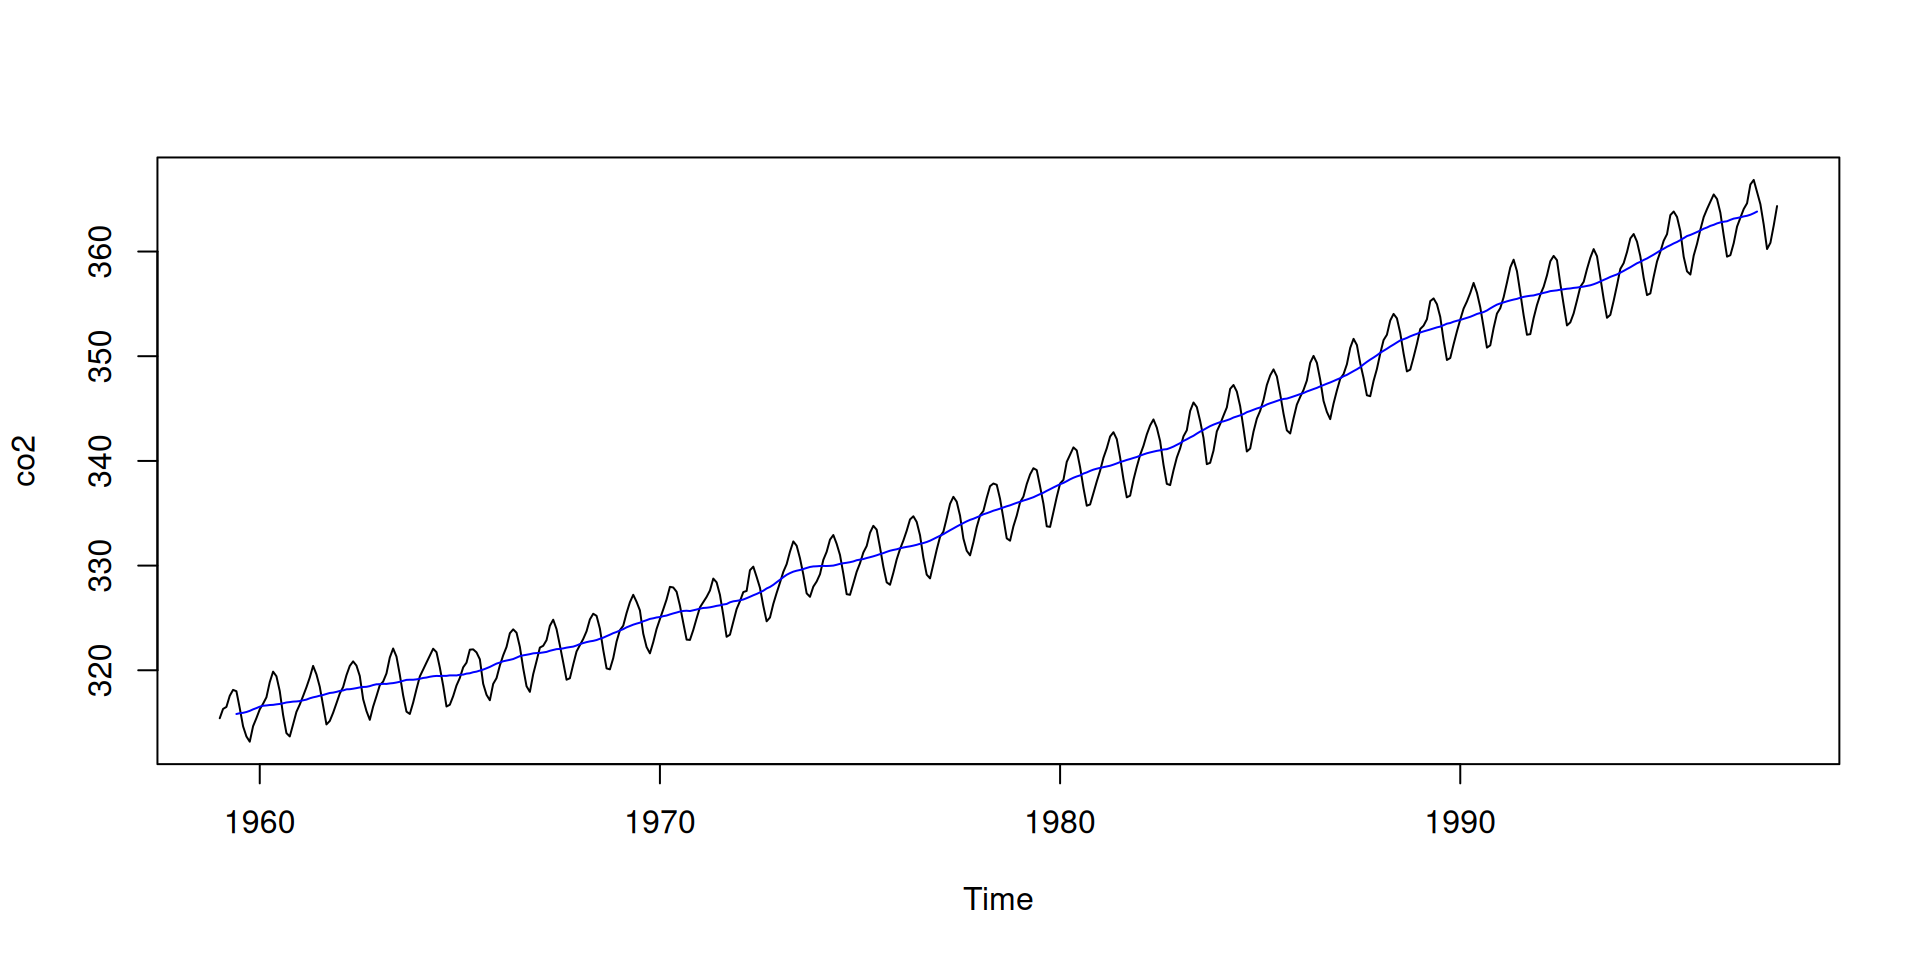
Moving averages over a white noise process:
#set.seed(13531)
e = rnorm(2000)
plot(e, type='l')
e5 = filter(e, rep(1/5, 5))
e20 = filter(e, rep(1/20, 20))
lines(e5, col='red')
lines(e20, col='blue')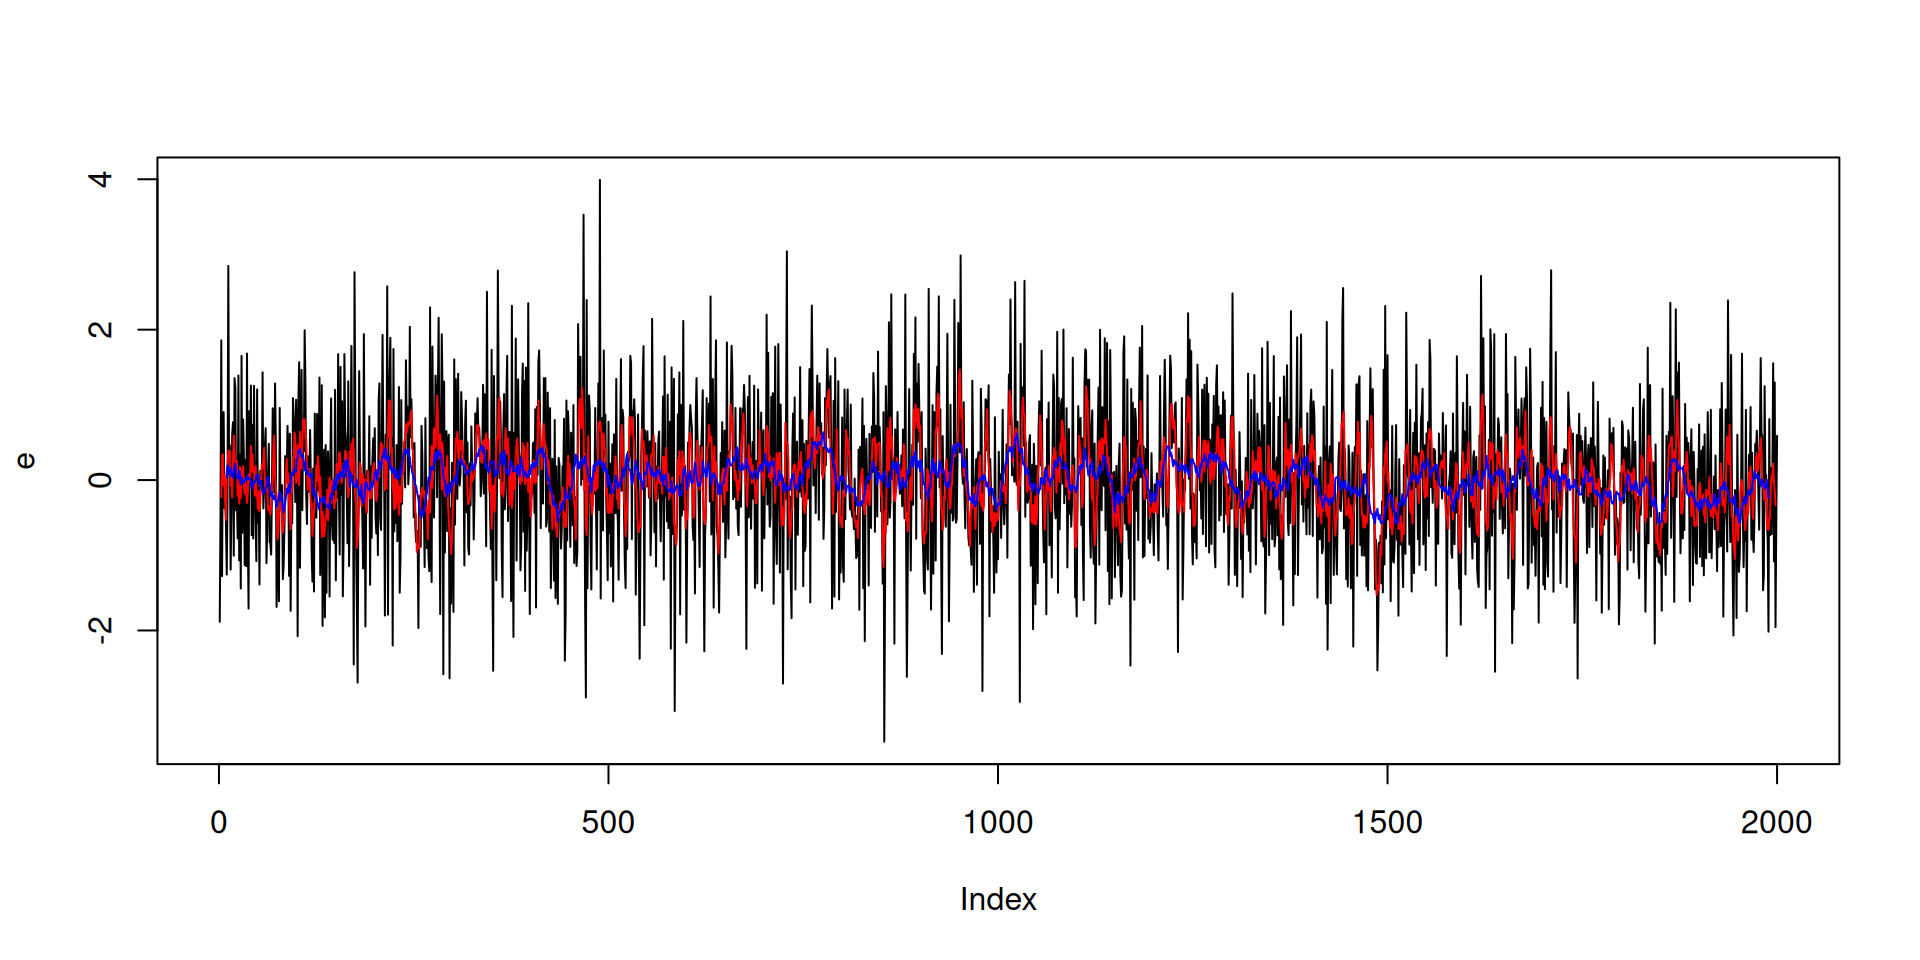
acf(e)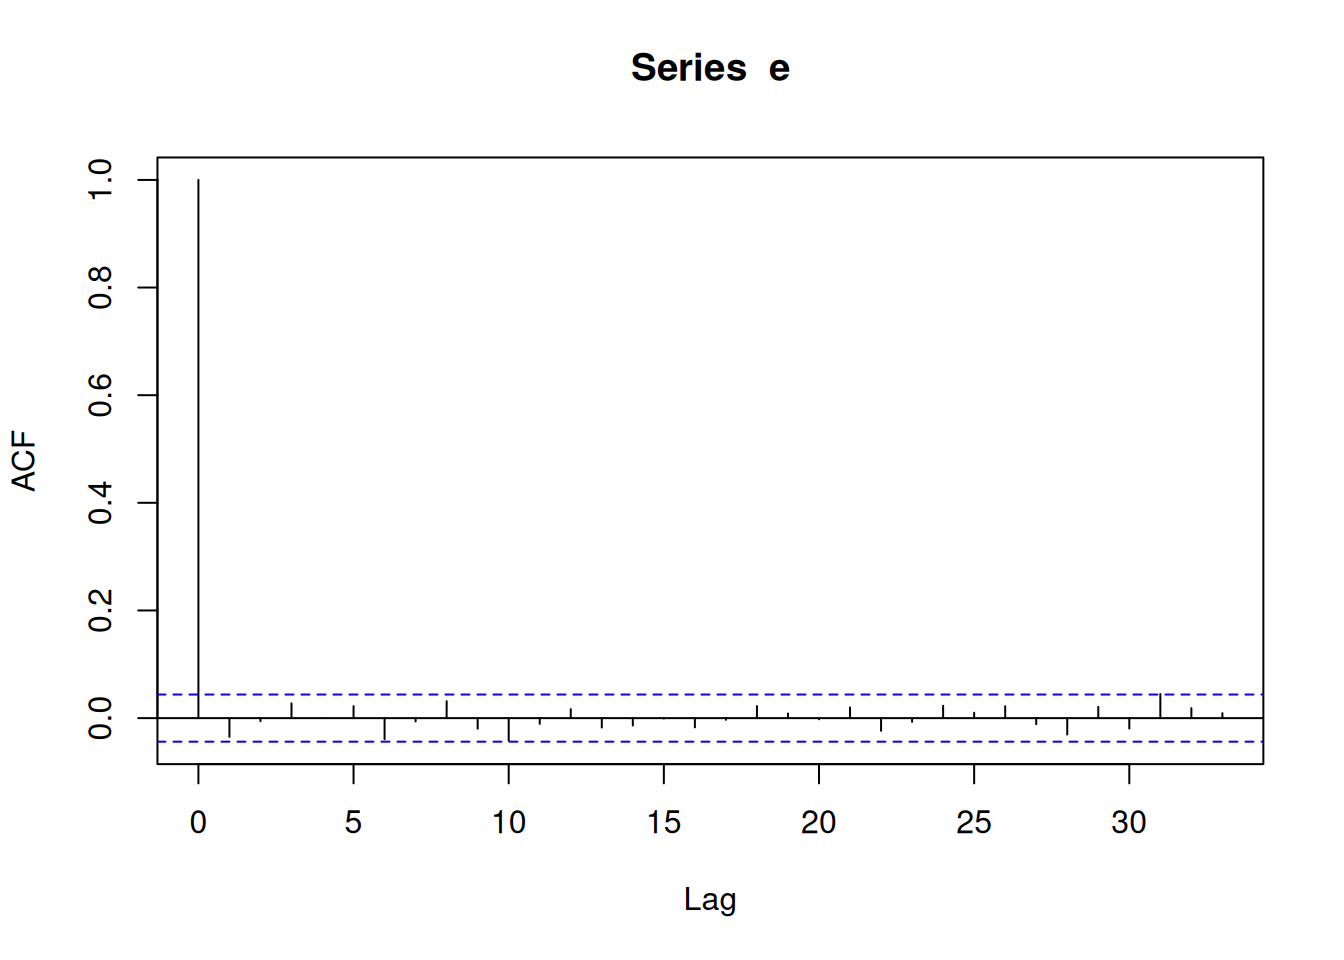
acf(e5, na.action = na.pass)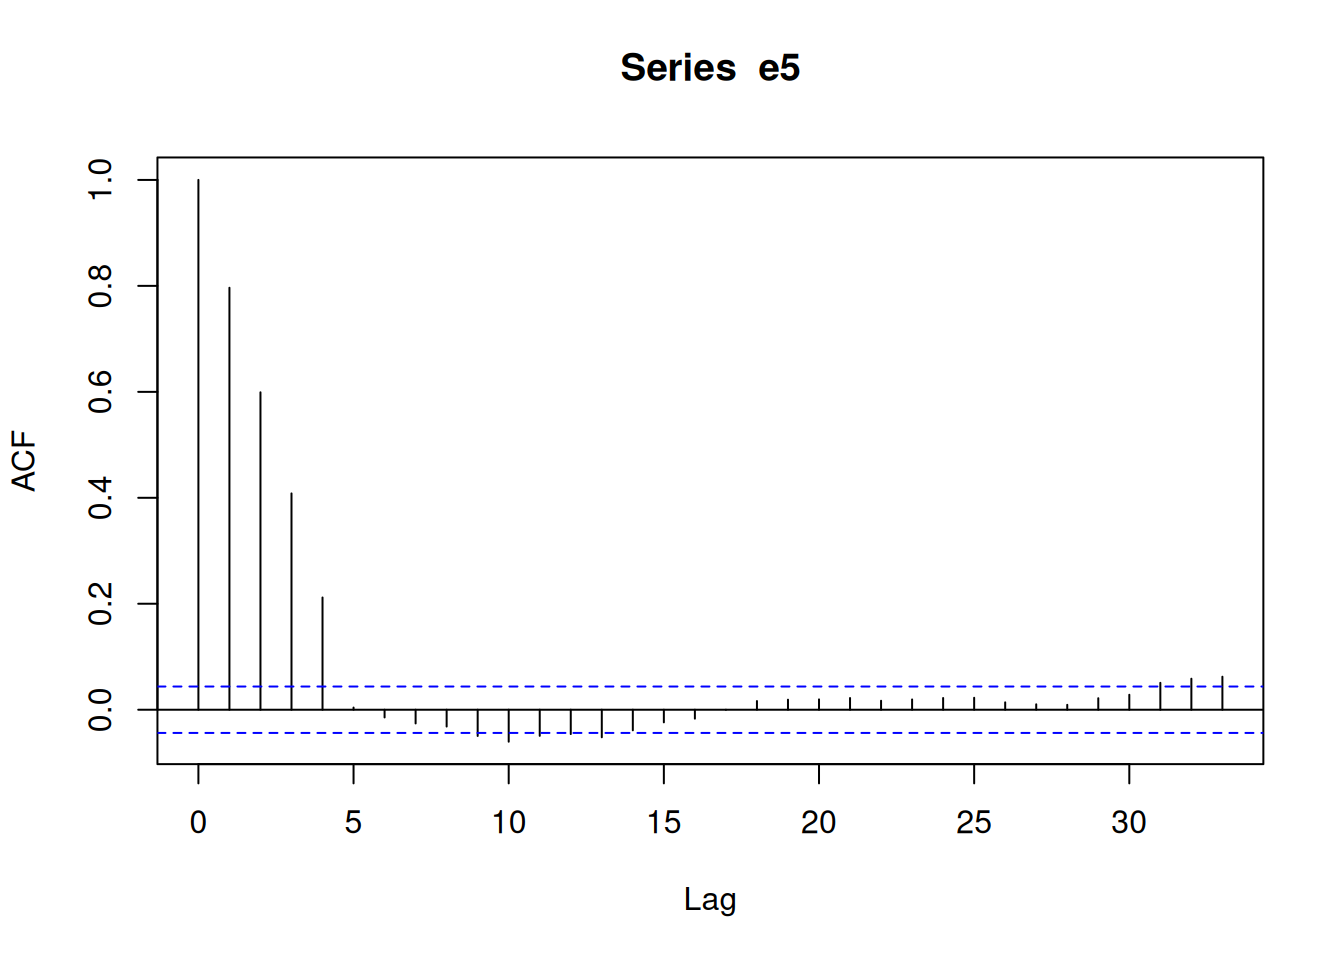
acf(e20, na.action = na.pass)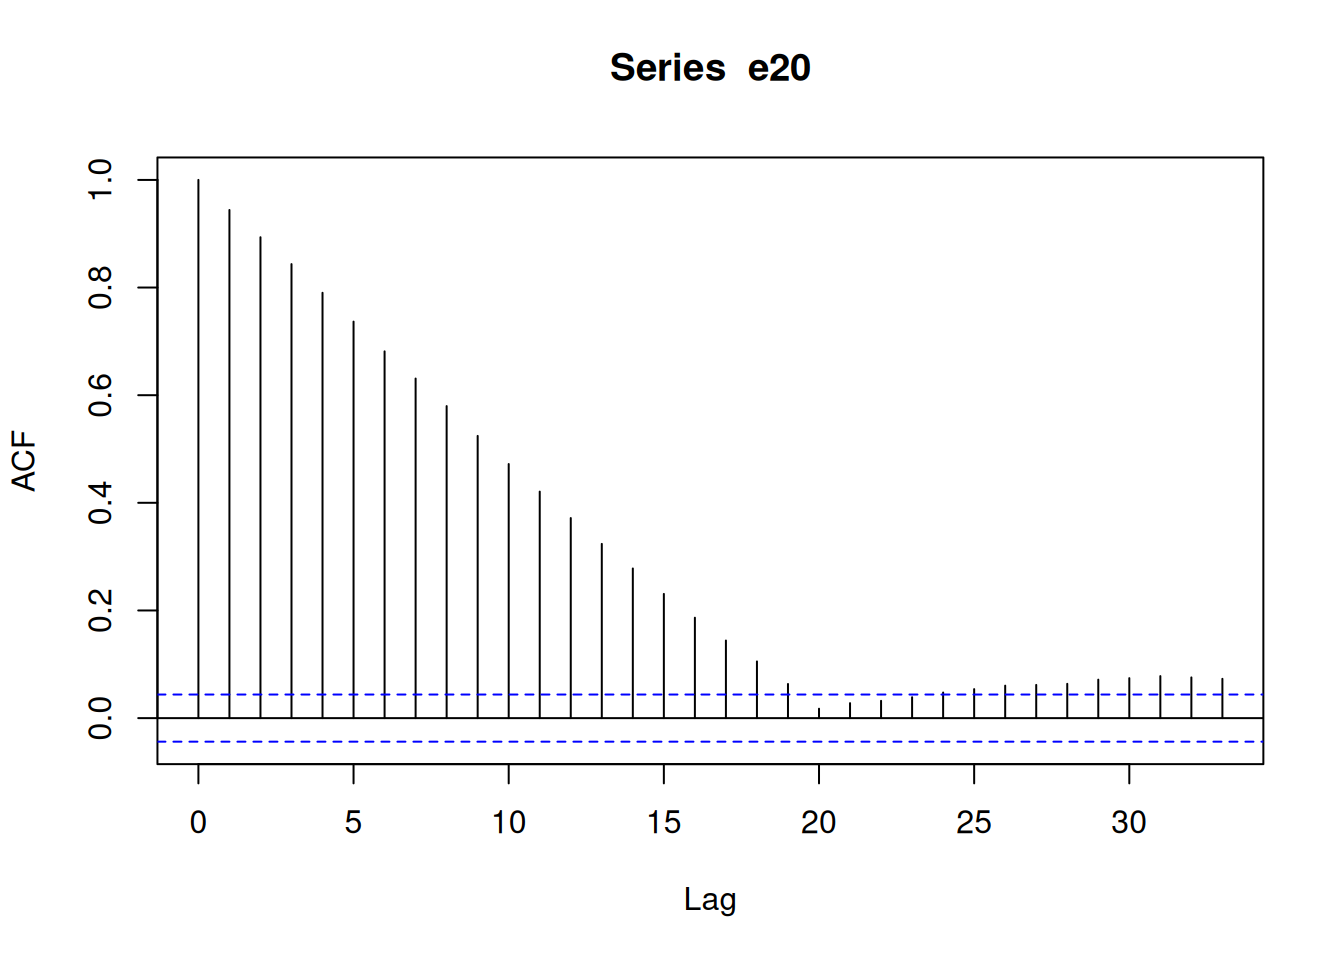
Wider moving average filters give new processes with
An auto-regressive (1) model, or AR(1) model is generated by \[y_t = \phi_1 y_{t-1}+e_t\] and is sometimes called a Markov process. Given knowledge of \(y_{t-1}\), observations further back carry no information; more formally: \[\Pr(y_t|y_{t-1},y_{t-2},...,y_{t-q}) = \Pr(y_t|y_{t-1})\]
As an example, we create (simulate) an AR(1) process with \(\phi_1=0.85\) and \(e\) drawn from the standard normal distribution (mean 0, variance 1).
n = 1000
y = rep(NA_real_, n) # initialise the variable: not needed, but good practice
y[1] = 0
for (i in 2:n) y[i] = 0.85 * y[i-1] + rnorm(1)
plot(y, type = 'l', main = "AR(1)")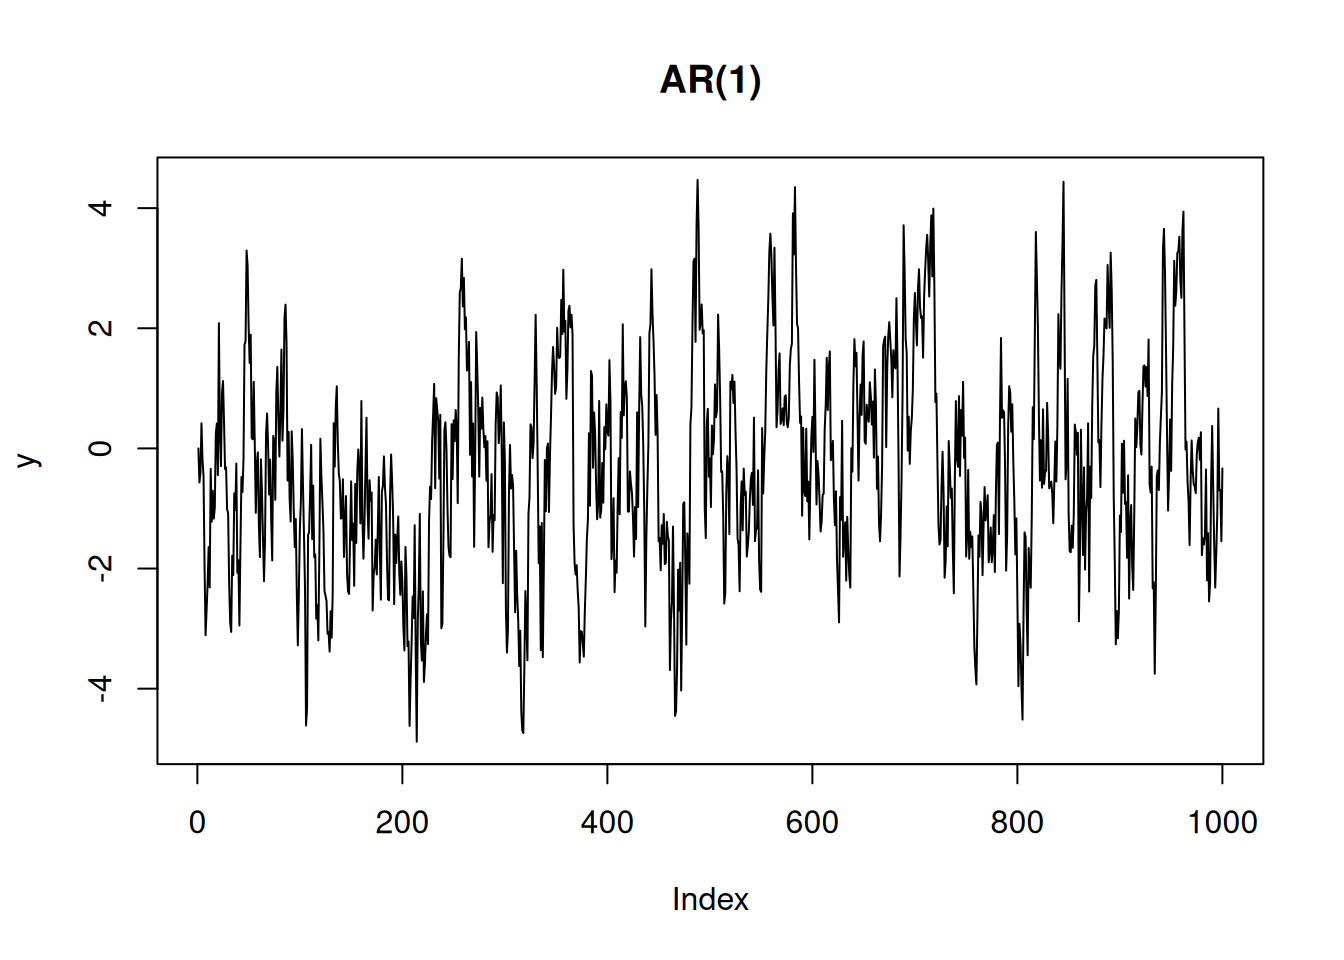
plot(acf(y))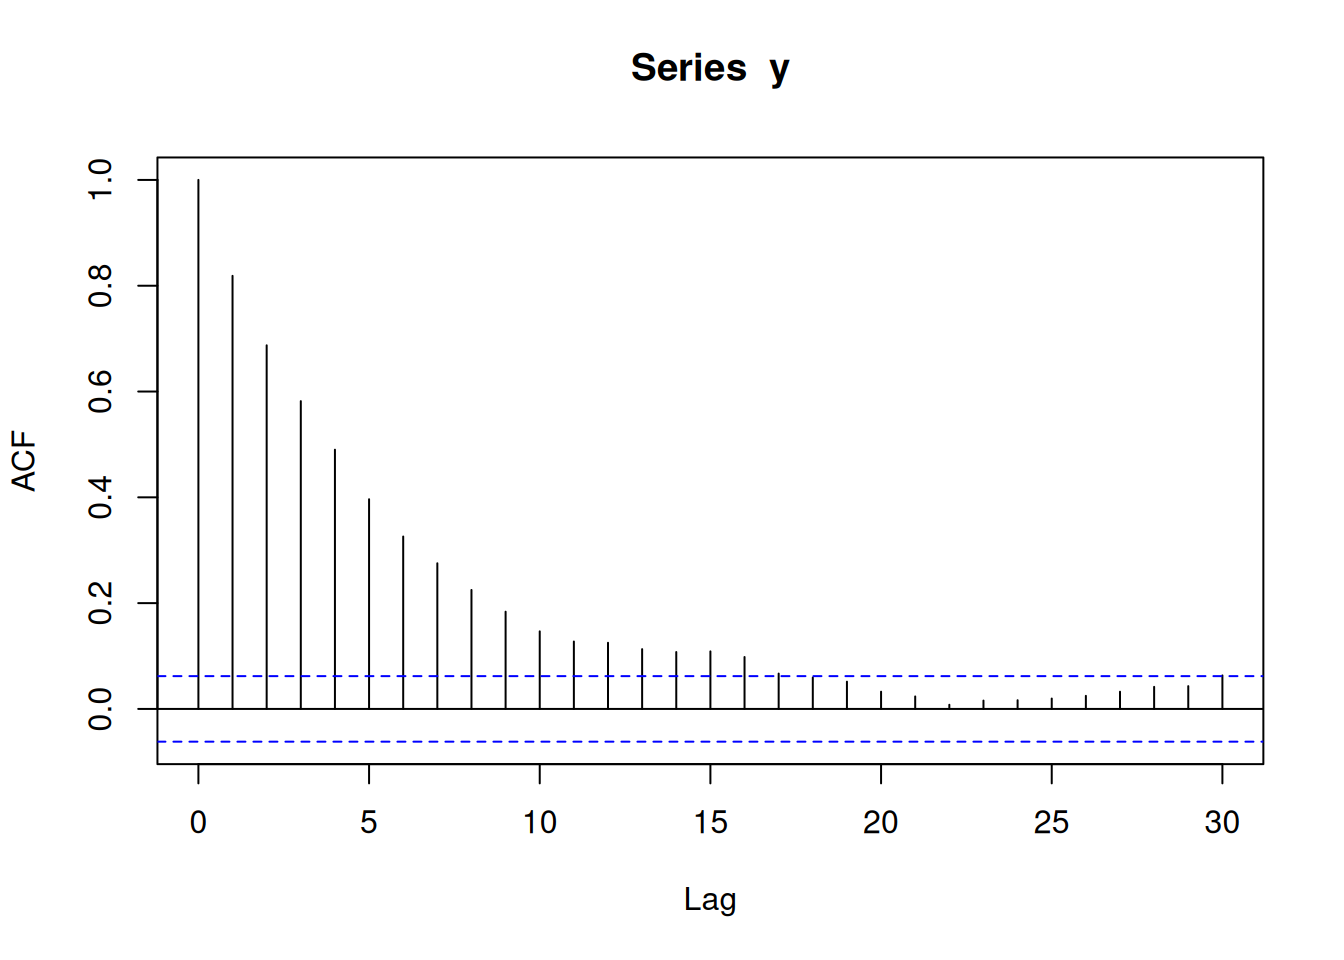
Compare the shape of the acf with that obtained from a MA process: different!
\[y_t = \phi_1 y_{t-1}+ \phi_2 y_{t-2} + ... + \phi_p y_{t-p} + e_t\] or \[y_t = \sum_{j=1}^p \phi_j y_{t-j}+e_t\]
y2 = rep(NA_real_, 1000) # initialise the variable: not needed, but good practice
y2[1] = 0; y2[2] = rnorm(1)
for (i in 3:1000) y2[i] = 0.5 * y2[i-1] + 0.15 * y2[i-2] + rnorm(1)
plot(y2, type = 'l', main = "AR(2)")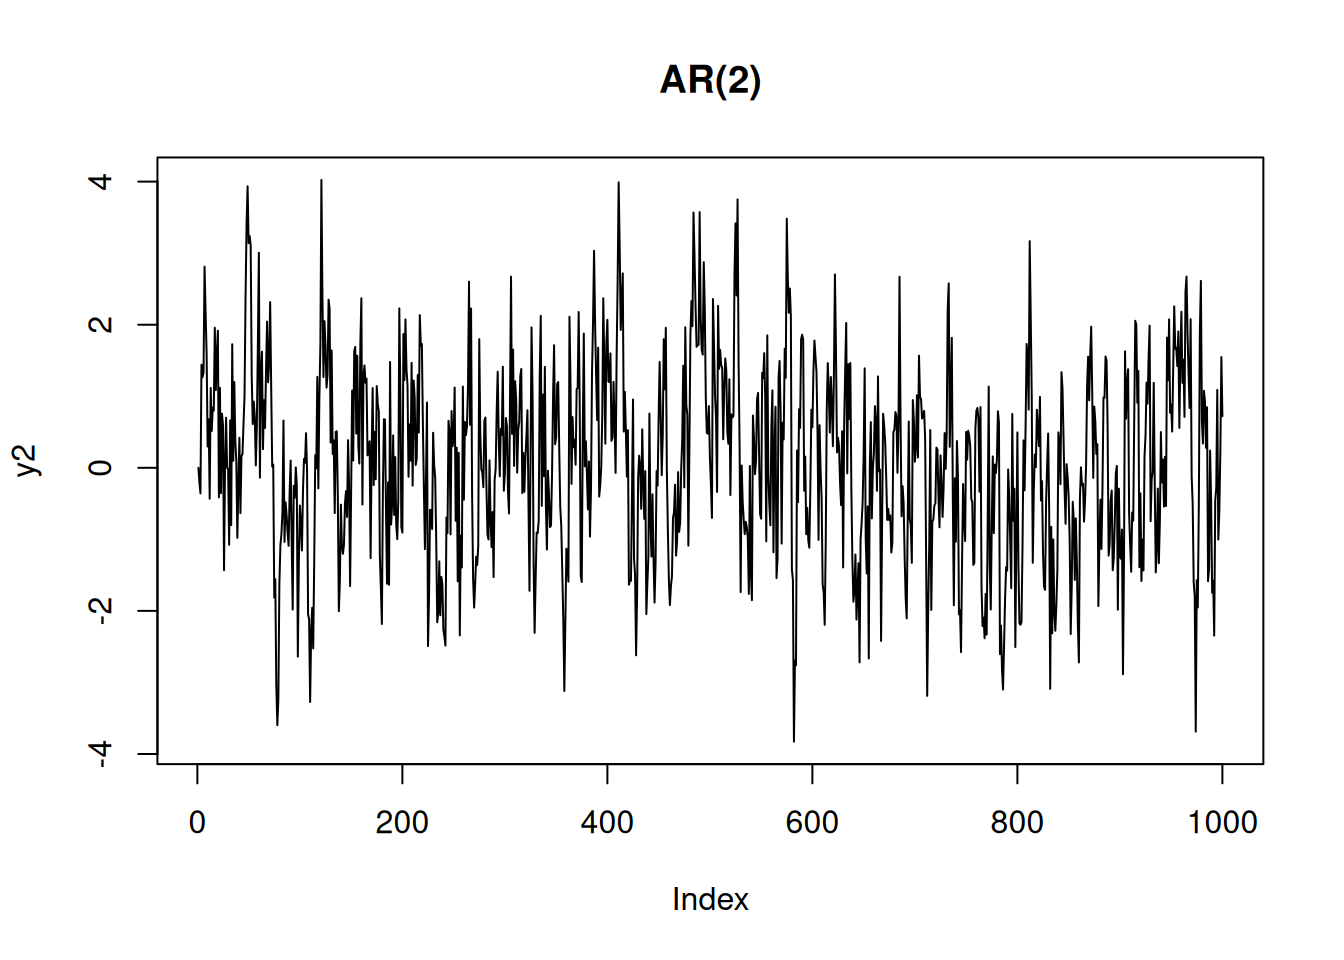
plot(acf(y2))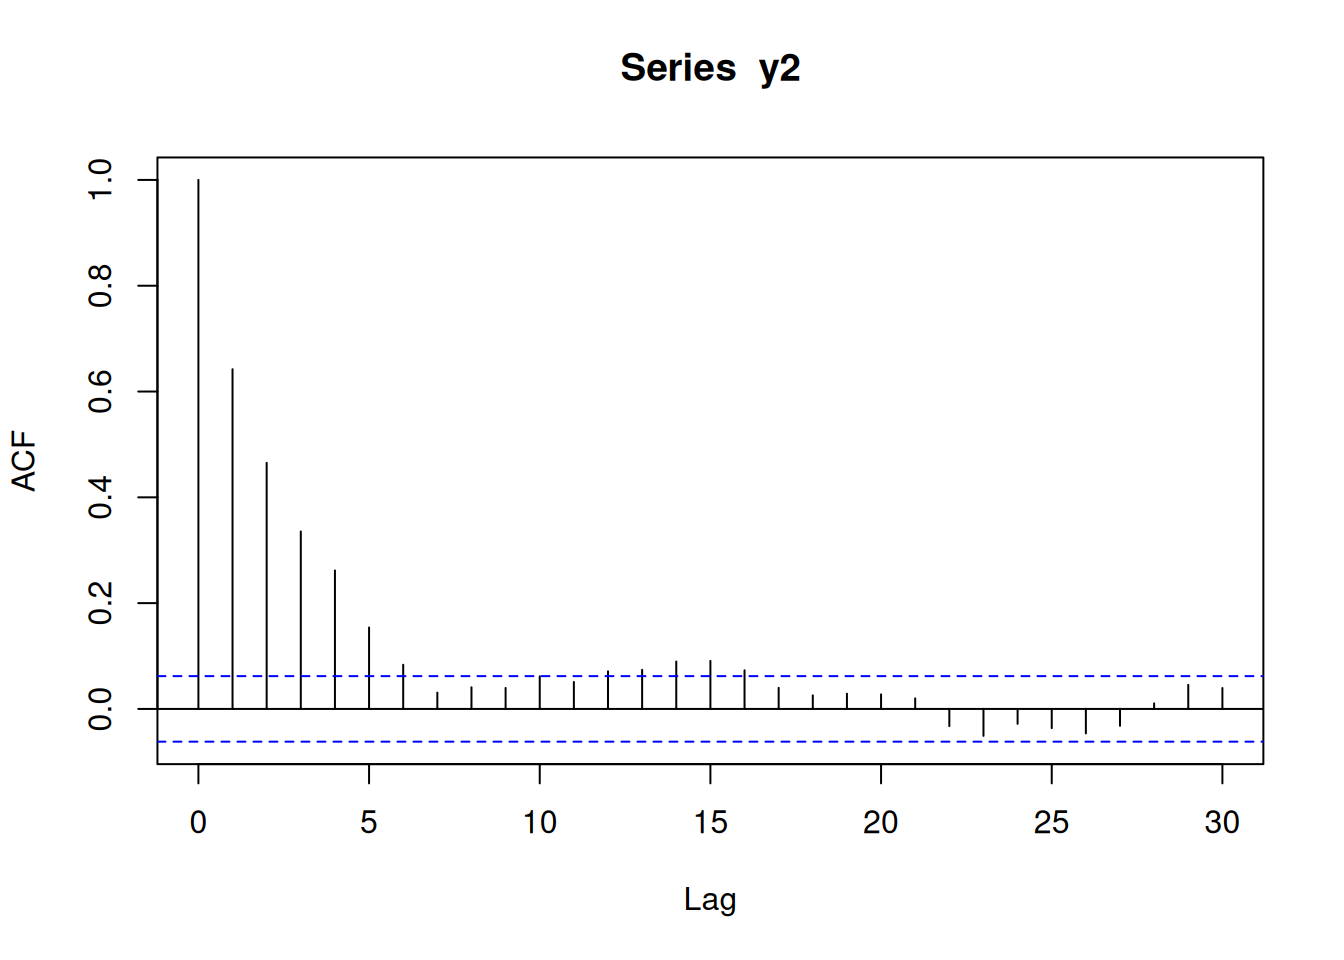
Partial correlation can help reveal what the order of an MA(q) or AR(p) series is:
plot(pacf(e5, na.action = na.omit))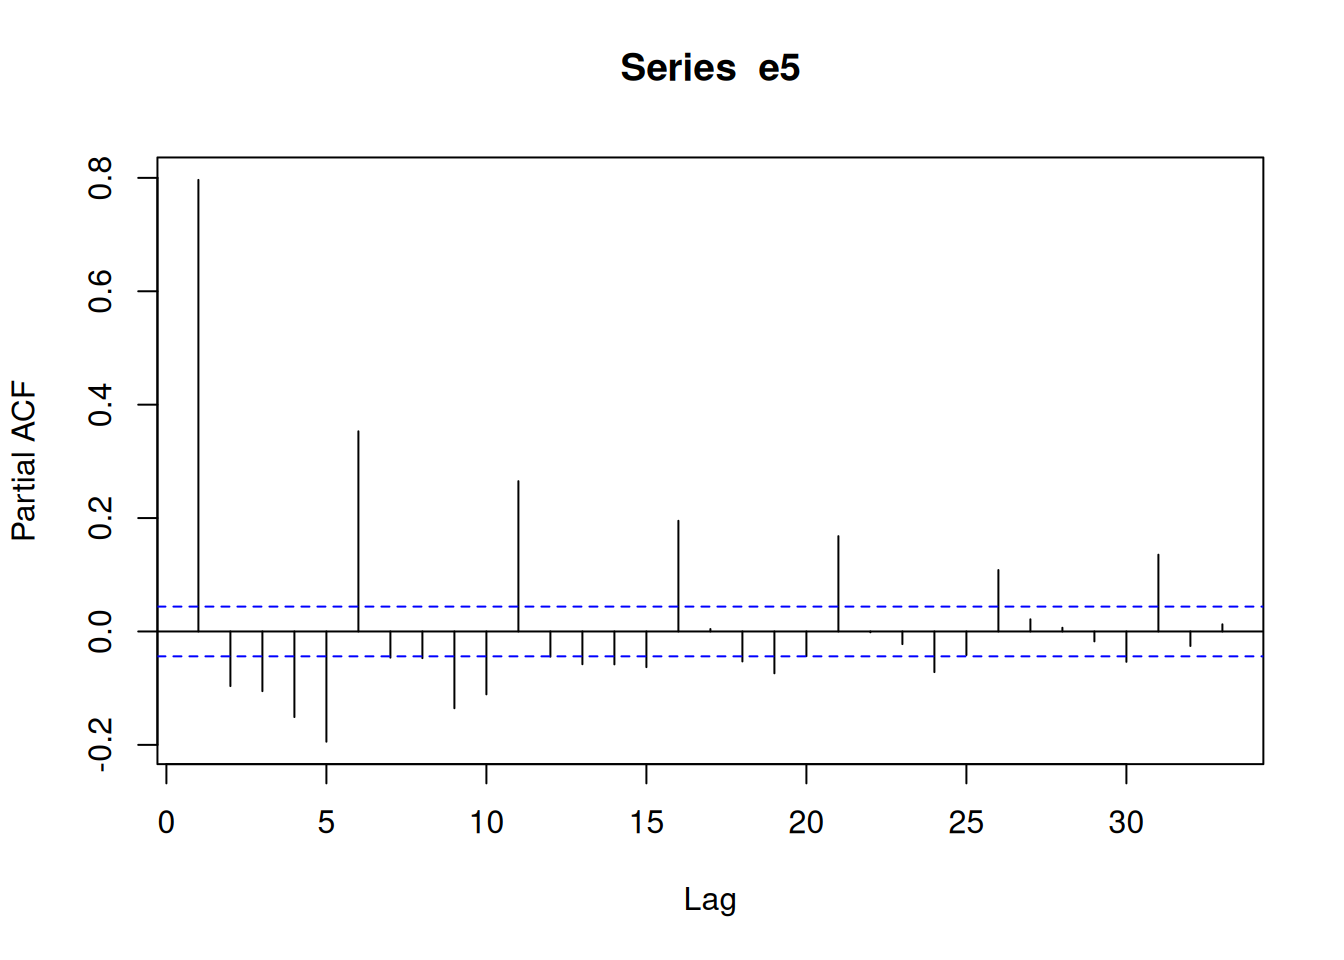
plot(pacf(e20, na.action = na.omit))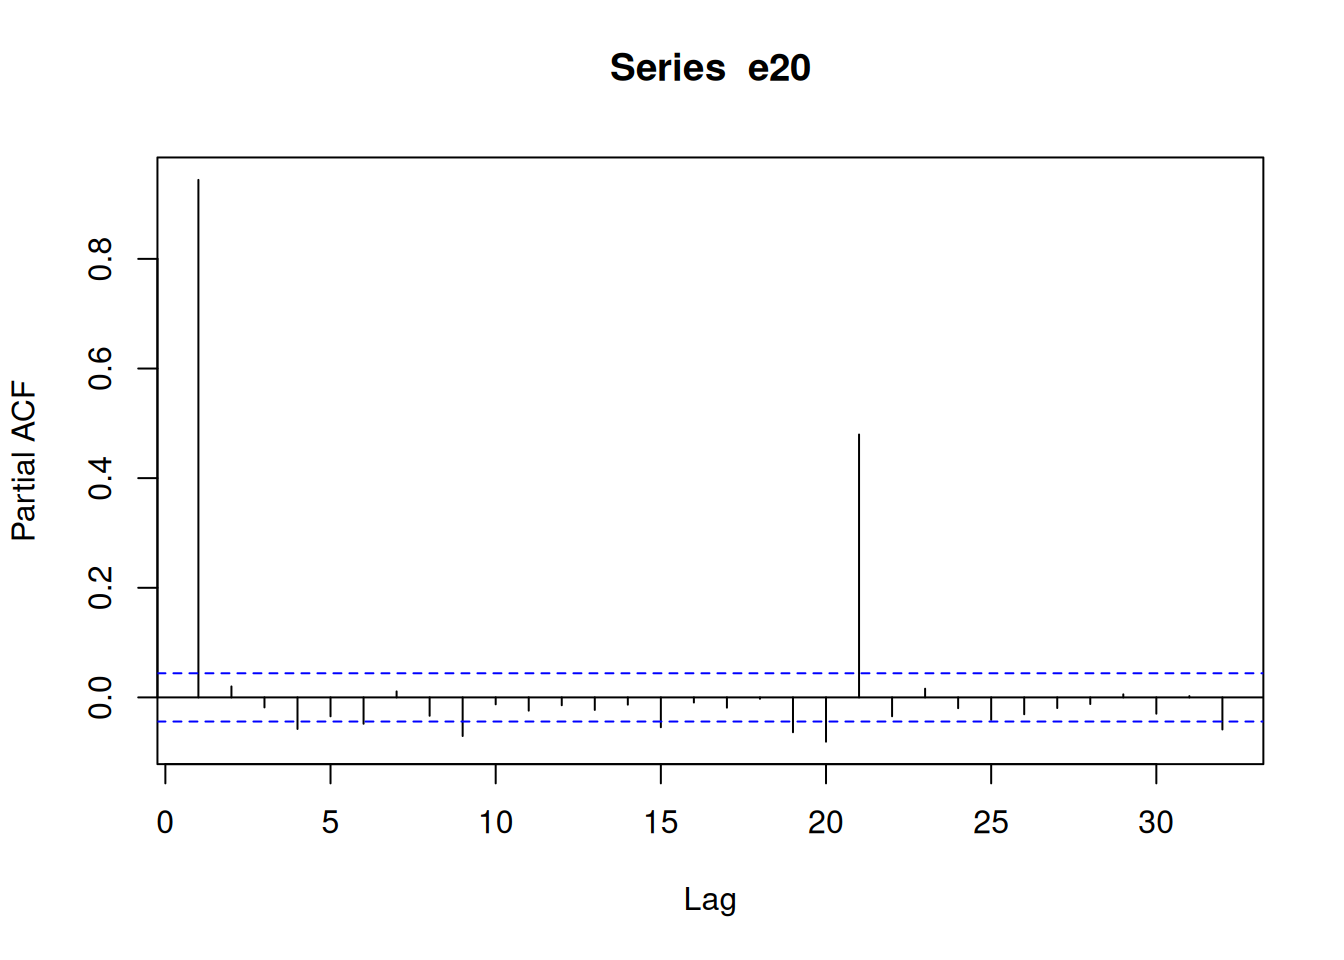
plot(pacf(y))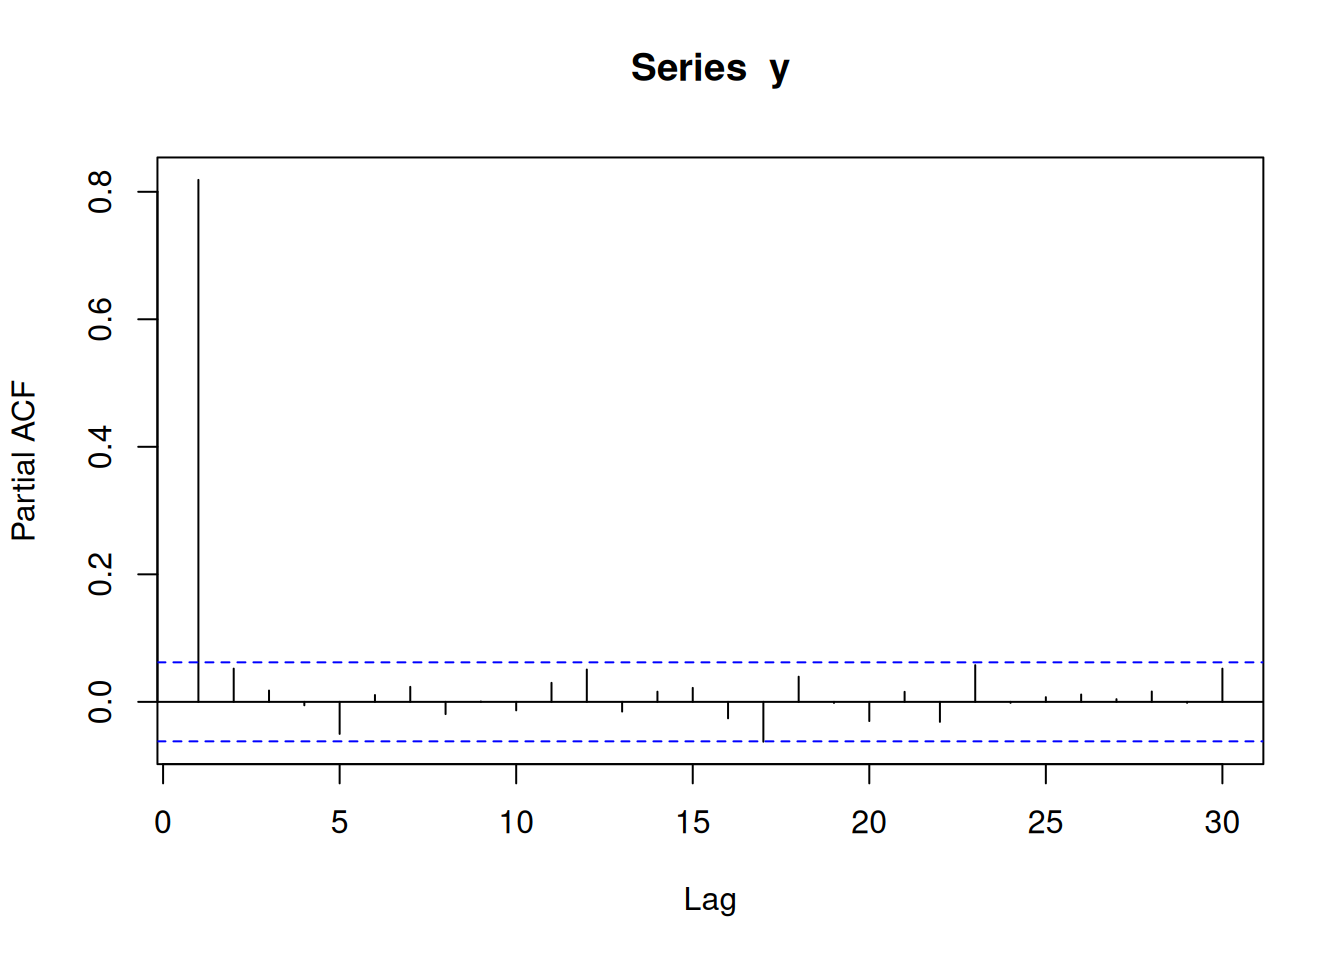
plot(pacf(y2))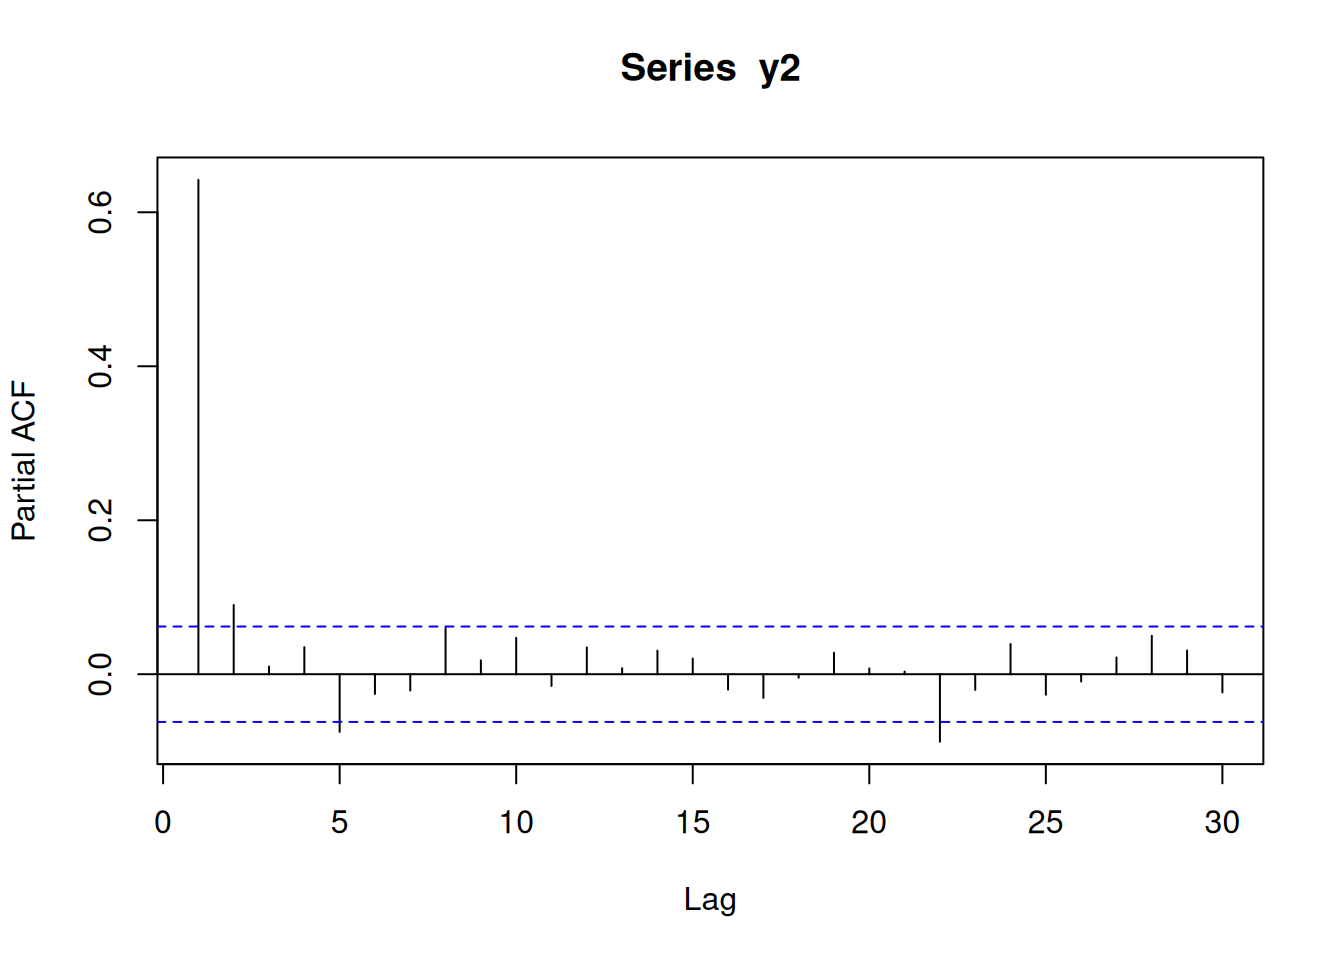
Chatfield (Chatfield and Xing 2019) has more details about this. Substitute the AR(1) as follows \[y_t = \phi_1 y_{t-1} + e_t\] \[y_t = \phi_1 (\phi_1 y_{t-2} + e_{t-1}) + e_t\] \[y_t = \phi_1^2 (\phi_1 y_{t-3} + e_{t-2}) + \phi_1 e_{t-1} + e_t\] etc. In the limit, we can write any AR process as an (infinite) MA process, and vice versa.